Announcement
This page is also available in Português, Deutsch, Español, Italiano, Français, and 日本語.
Warehouse p9x metrics and cache usage
Improved capabilities for monitoring warehouse performance and understanding the impact of configuration changes.
By SELECT Team
Ian WhitestoneCo-founder & CEO of SELECT
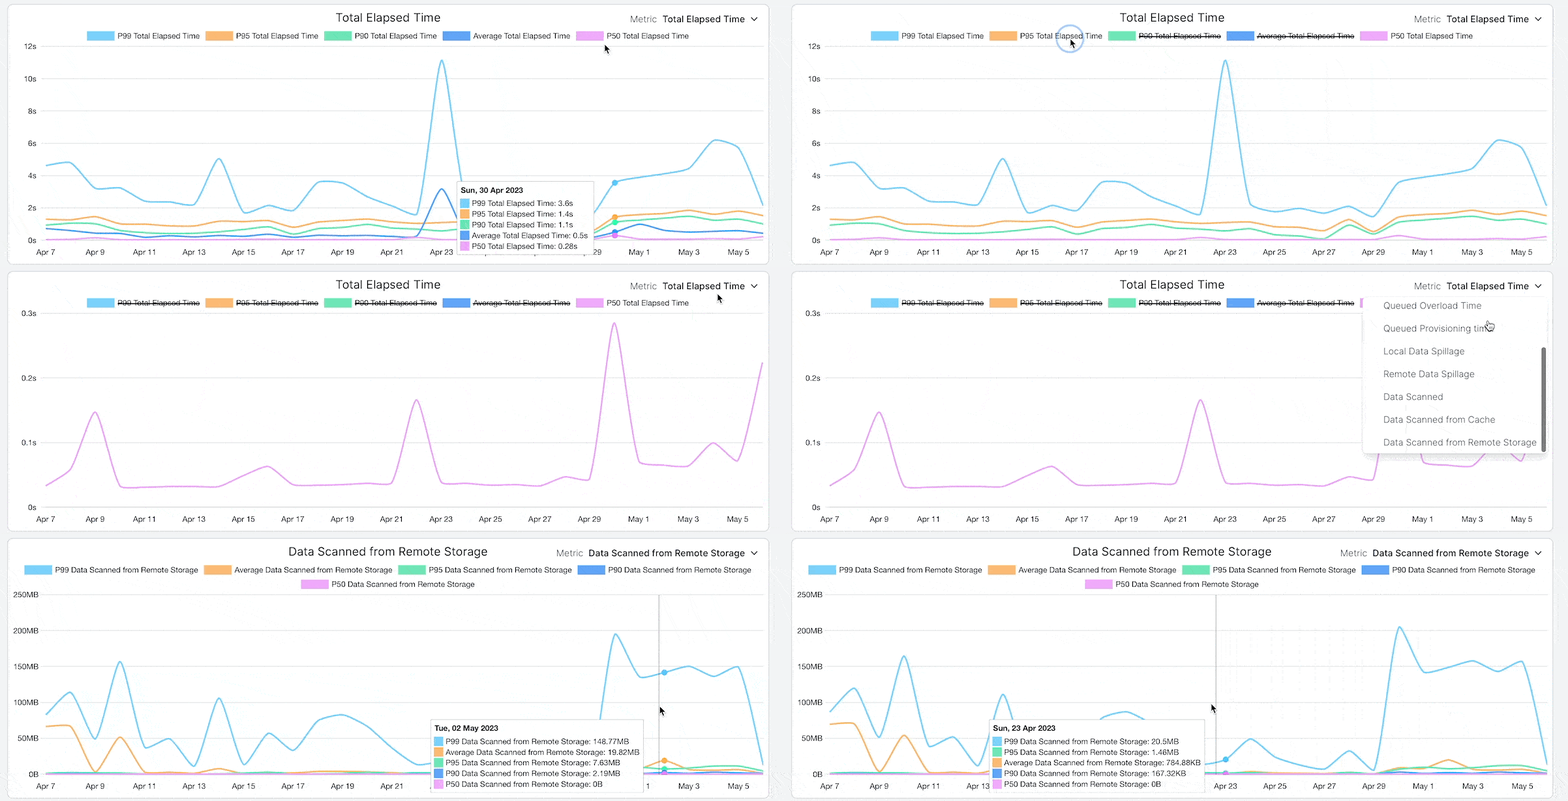
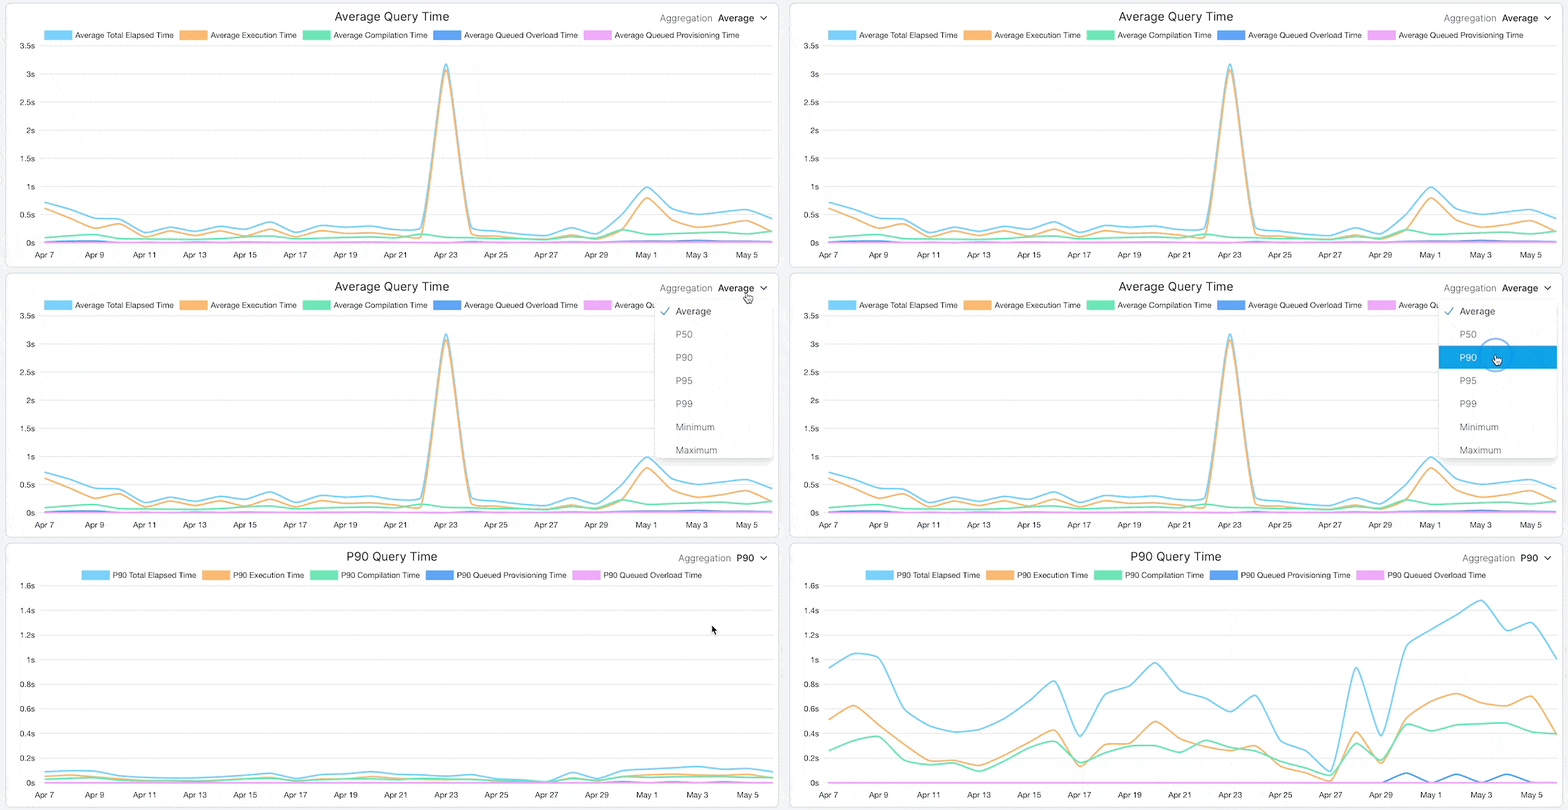
To help with monitoring performance and understanding the impact of warehouse or query changes, we’ve added three new capabilities to the warehouse performance tab.
Monitor a larger variety of aggregation types (avg, p50 through p99) across any metric.
Analyze query times with any aggregation type (min, max, avg, p50 through p99).
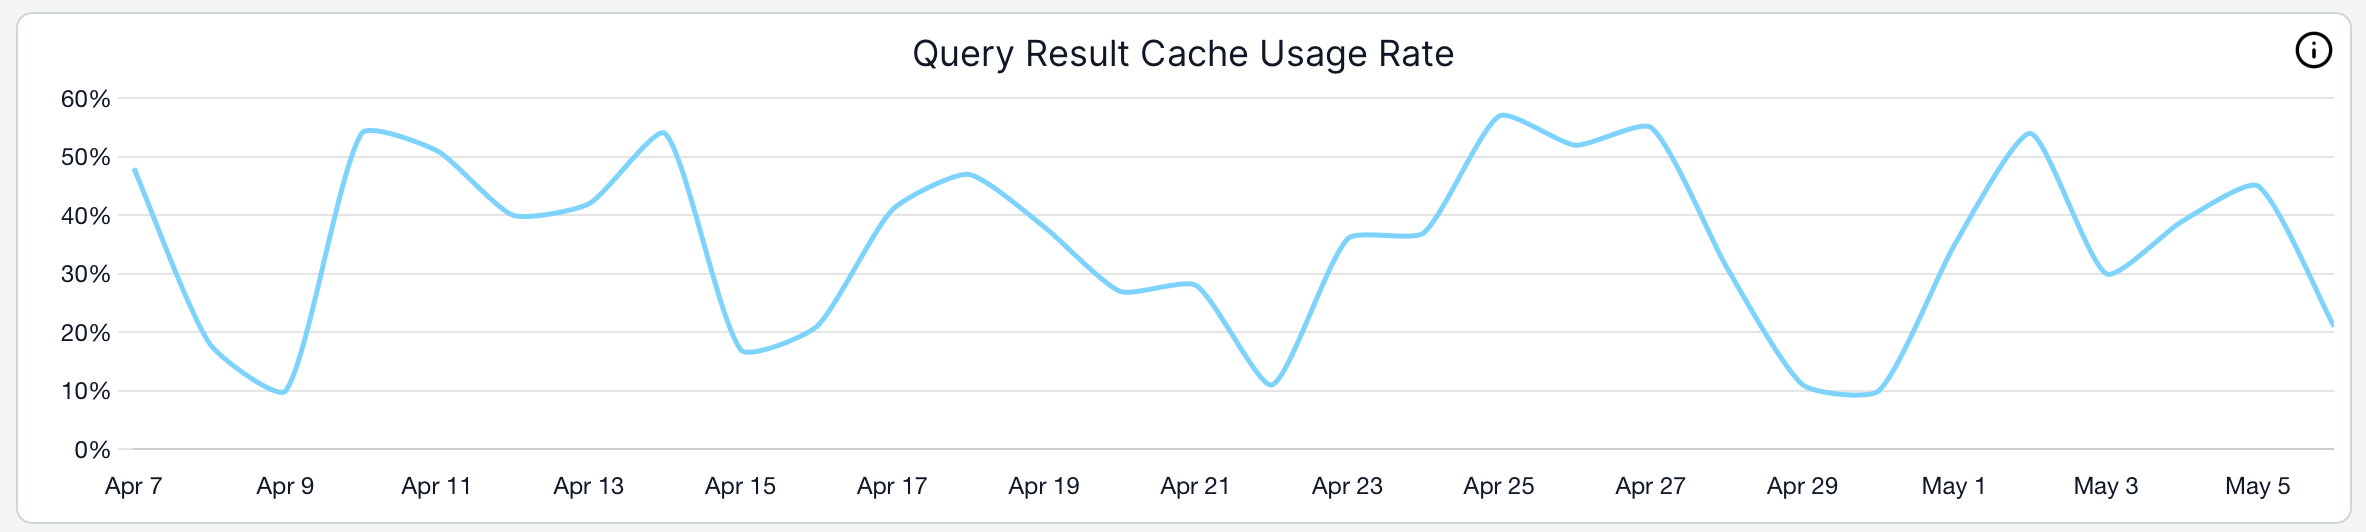
Monitor query result cache usage rates to better understand performance.