Announcement
This page is also available in Português, Deutsch, Español, Italiano, Français, and 日本語.
Understanding period over period changes
Easily understand how resources and workloads changed in the given period.
By SELECT Team
Niall WoodwardCo-founder & CTO of SELECT
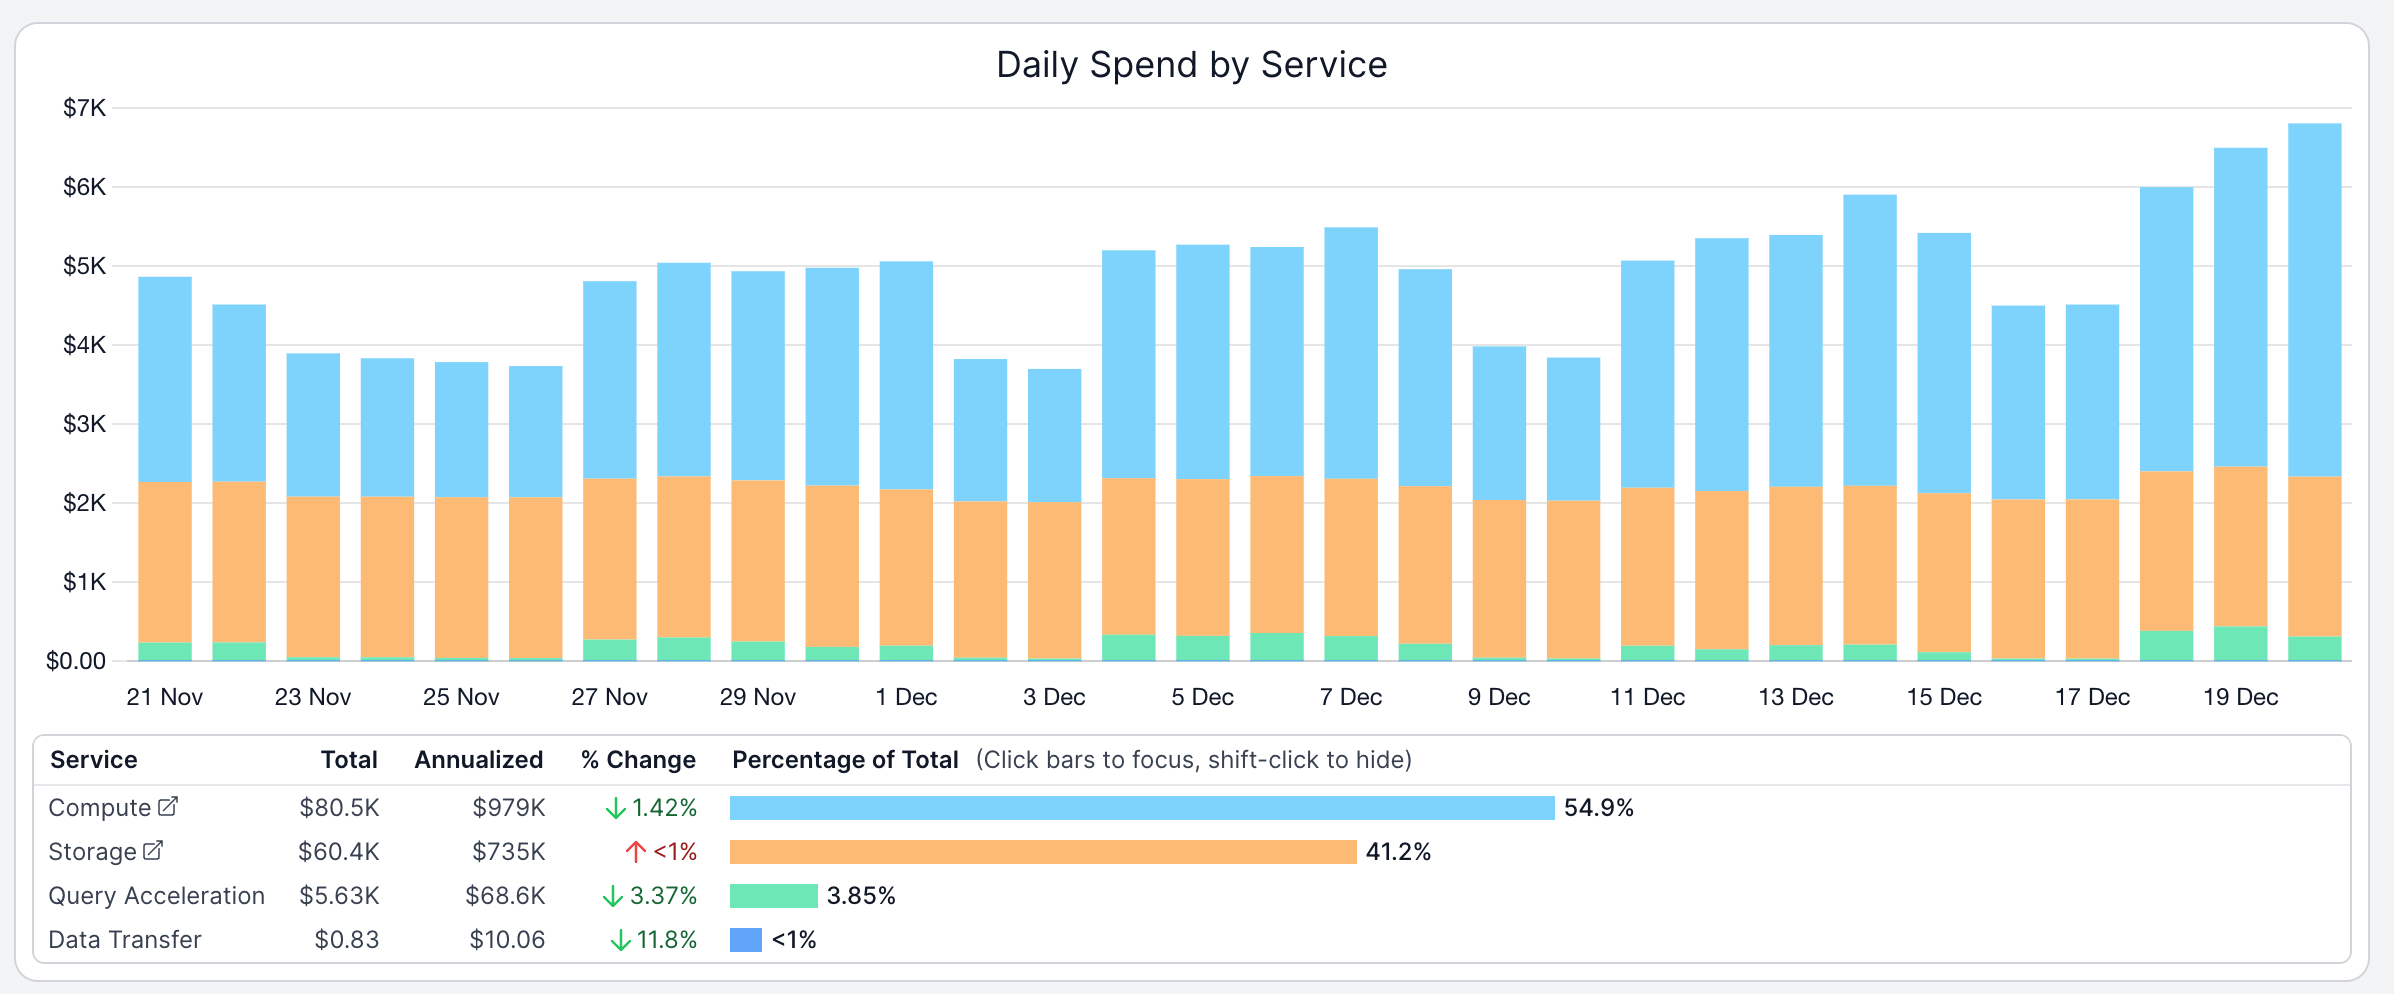
To help you more easily understand how your consumption has changed, we've added a new % Change column to all tables below each chart. This allows you to quickly identify how resources have changed in a given period.
The example below shows Snowflake spend between November 21 and December 20. In this example, Compute spend decreased by 1.42% relative to the previous 30 day period (October 21 to November 20).